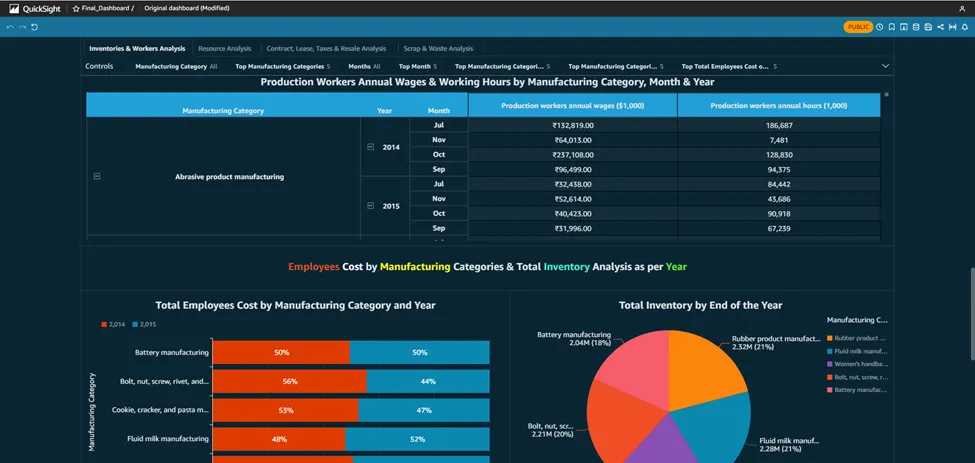
Create dashboards on AWS QuickSight & make it accessible publicly on the internet

Amazon Quicksight powers data-driven organizations with unified business intelligence (Bi) at hyperscale. With the Quicksight, all users can meet varying analytic needs from the same source of truth through modern interactive dashboards, paginated reports, embedded analytics and natural language queries.
Benefits of AWS QuickSight :-
Build faster : Speed up the development by using one authoring experience to build modern dashboards and reports. Developers can quickly integrate rich analytics and ML-powered natural language query capabilities into applications with one-step, public embedding and rich APIs.
Low cost : Pay for what you use with the quicksight usage-based pricing. No need to buy thousands of end-user licenses for large scale Bi/embedded analytics deployments. With no servers or software to install or manage. Also can lower costs by removing upfront costs and complex capacity planning.
BI for everyone : Deliver insights to all your users when, where and how they need them. Users can explore modern & interactive dashboards, get insights within their applications, obtain scheduled formatted reports with reports and make decisions with ML insights.
Scalable : Quicksight is serverless, it automatically scale to tens of thousands of users without the need to set up, configure or manage your own servers. The Quicksight in-memory calculation engine, SPICE provides consistently fast response times for end users, removing the need to scale databases for high workloads.
Lets Start With QuickSight :-
Create a manifest file for uploading the dataset :
· Initially we have uploaded the data & manifest file into AWS S3.
· To create a manifest file you can refer the following.
· We have created a manifest file named manifest.json.
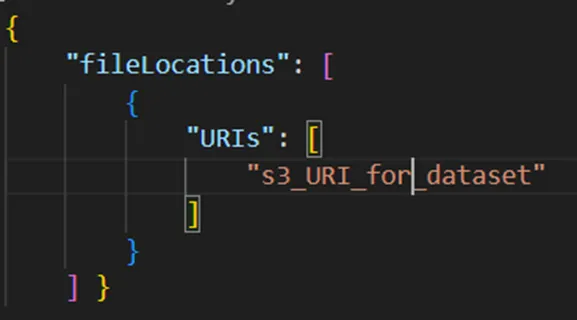
· Navigate to Quicksight in the AWS console.
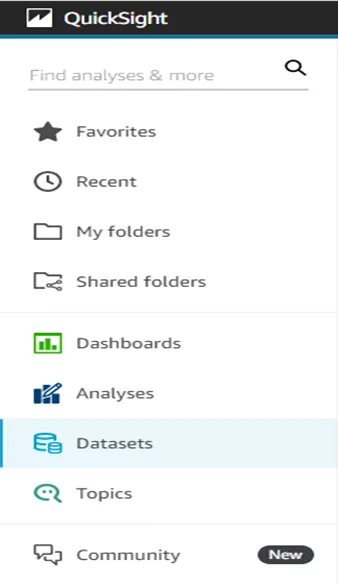
· Select the Datasets from the left side of the console.
· Click on New dataset to upload a new dataset.

· Now you will see the multiple datasources from where you can upload the data into quicksight.
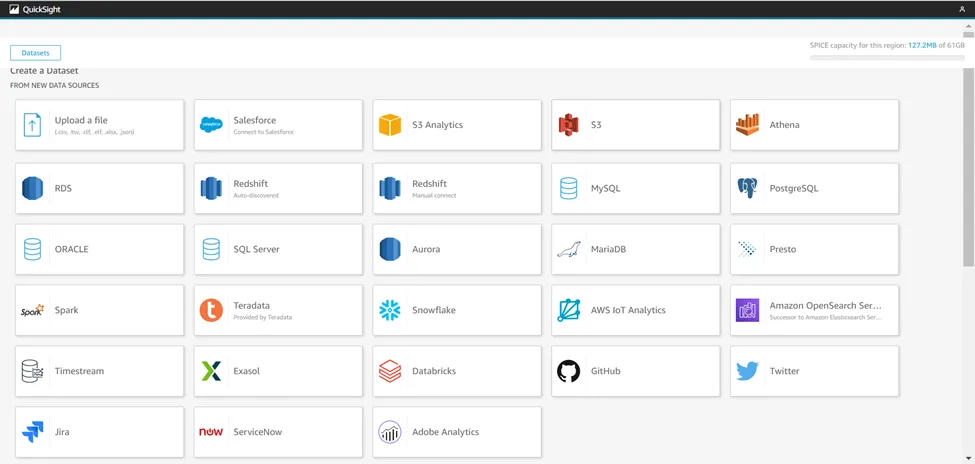
· So we are using S3 for the dataset.
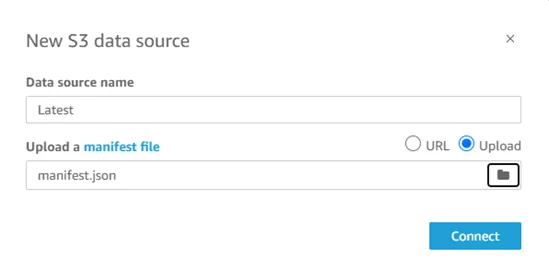
· Name the Dataset and upload the manifest file directly from the local by selecting Upload options or from S3 using URL.
· Click on connect to finish the upload.

· Here you will get the uploaded dataset which was named Latest.
Create a new analysis :
· Click on the Analyses to start the analysis and dashboards.
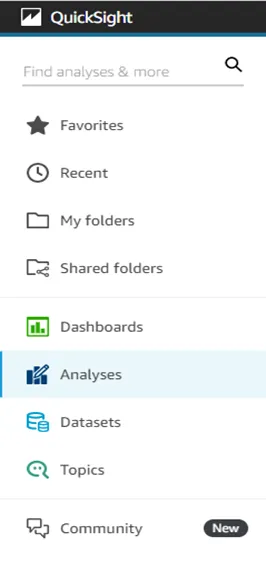
· Click on the New analysis button to start the analysis.

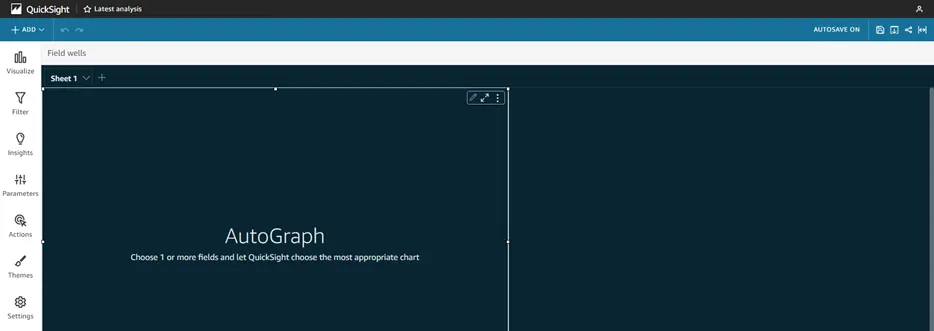
· Here you will be in the analysis, where you can do analysis, make dashboards and visuals.
Publish the dashboard and make it publically available :
· First save the analysis.
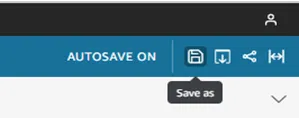
· Click on the Save icon & name the dashboard, Click on SAVE.

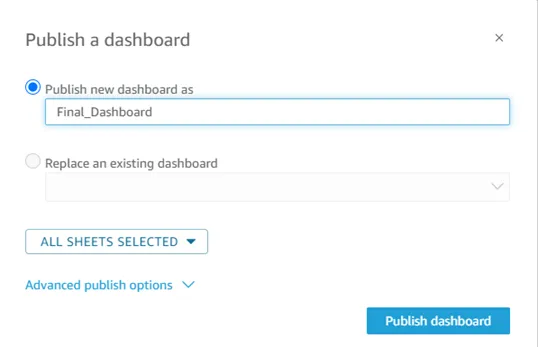
· Now click on the Share icon and select Publish dashboard option as shown below

· Name the dashboard & click on Publish dashboard button.
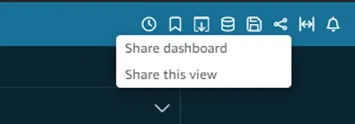
· Now Click on the share icon and select the Share dashboard option as shown below.
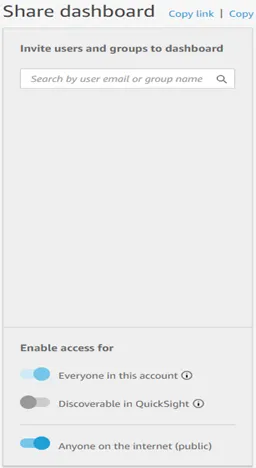
· You will see the option Anyone on the internet (public), just enable it.
· Copy the link by simply clicking on the Copy link.
· Paste the copied link in the browser or share it to anyone to see your dashboards.
