August 9, 2023

00 min read

INTRODUCTION TO DORA METRICS:
This blog is to explain the DevOps Research and Assessment capabilities to understand delivery and operational performance for better organizational performance.
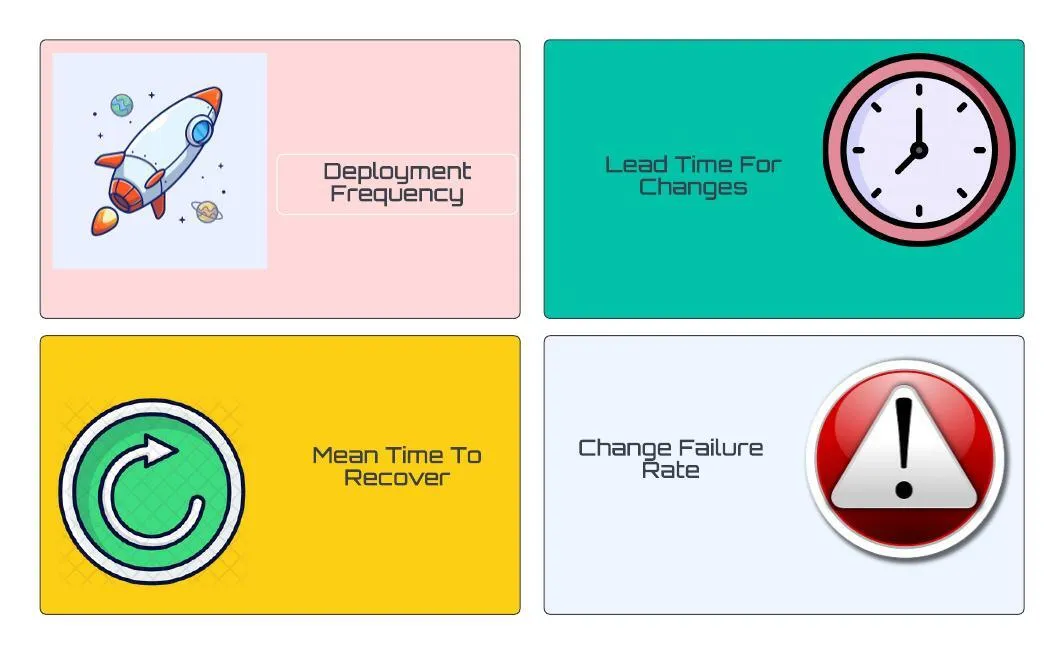
DORA — DORA (DevOps Research and Assessment) metrics help us to measure the DevOps performance if there are low or elite performers. The four metrics used are deployment frequency (DF), lead time for changes (LT), mean time to recovery (MTTR), and change failure rate (CFR).

The four essentials of DORA metrics:

  1. Deployment frequency
  2. Lead time for changes
  3. Mean time to recovery
  4. Change failure rate


Deployment Frequency :

Deploy frequency measures how often you deploy changes to a given target environment. Along with Change lead time, Deploy frequency is a measure of speed.

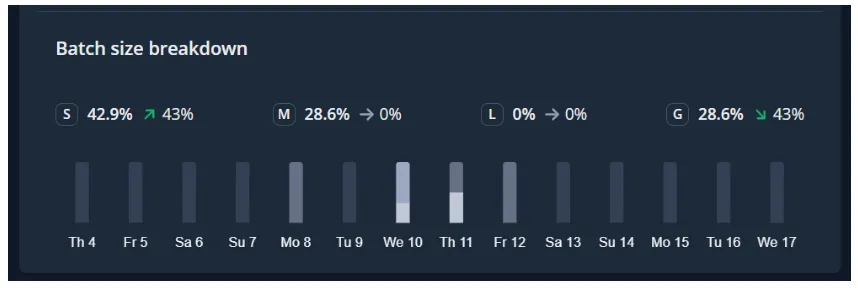
Deployment Frequency also provides us with Batch Size Breakdowns,

Allowing you to filter the code changes based on Small batch, Medium, Large, and Gigantic batch sizes.

  1. Small — usually 1 pull request, 1–10 commits, and a few hundred lines of code changed
  2. Medium — usually 1–2 pull requests, 10–30 commits, and many hundreds of lines of code changed
  3. Large — usually 2–4 pull requests, 20–40 commits, and many hundreds of lines of code changed
  4. Gigantic — usually 4 or more pull requests or 30 or more commits or many thousands of lines of code changed.

Lead Time for Change:

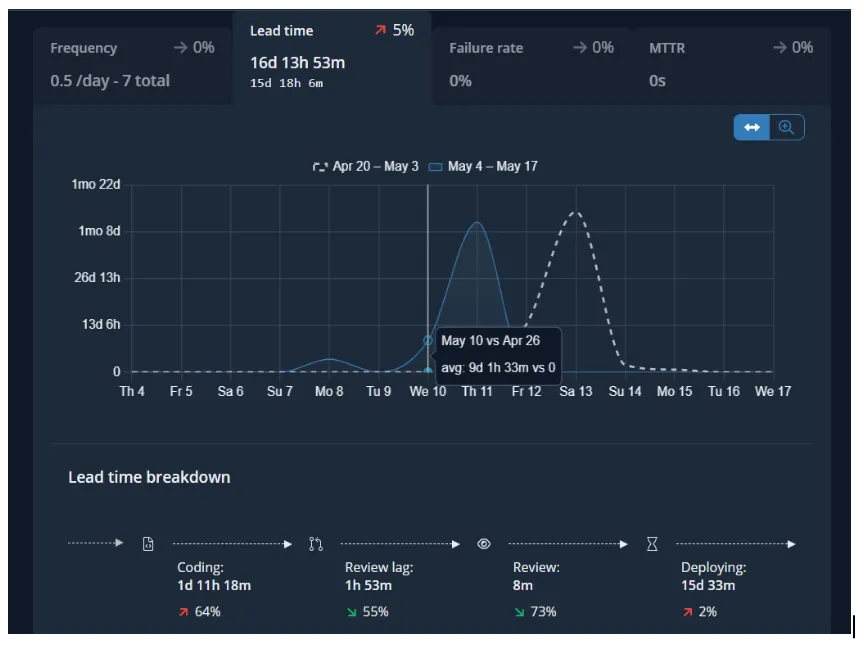
Change lead time measures the time it takes for a change to go from its initial start of coding to being deployed in its target environment. Like Deploy frequency, Change lead time is a measure of speed (whereas Change failure rate and MTTR are measures of quality or stability).

In addition to the Lead Time for Change, Sleuth provided us with a detailed breakdown of how much time your teams, on average, are spending.

  • Coding — the time spent from the first commit (or the time spent from the first transition of an issue to an “in-progress state) to when a pull request is opened
  • Review lag time — the time spent between a pull request being opened and the first review
  • Review time — the time spent from the first review to the pull request being merged
  • Deploying — the time spent from pull request merge to deployment

Mean Time to Recovery:

Change failure rate measures the percentage of deployed changes that cause their target environments to end up in a state of failure. Along with MTTR, Change failure rate is a measure of the quality, or stability of your software delivery capability.

Change Failure Rate

Measures the quality and stability while deployment frequency and Lead Time for Changes don’t indicate the quality of the software but just the velocity of the delivery.

Here’s a table of how DORA metrics are calculated depending on the deployment that occurred, coding and review time, time is taken to restore from an incident or a failure, and failure rate that occurred due to the deployments.

Apart from the four metrics of DORA, there is a fifth one, Reliability, happens to be most important when it comes to operational performance which brings together DevOps and SRE teams to build us a better infrastructure and software. The Reliability metrics is a great way to showcase a team’s overall software delivery performance.

Become an Elite :

According to the most recent State of DevOps report, elite performers have recently grown to now represent 20% of survey respondents. High performers represent 23%, medium performers represent 44%, and low performers only represent 12%.

CONCLUSION :

DORA metrics are a great way to measure the performance of your software development and deployment practices. DORA metrics can help organizations to measure software delivery and stability to a team’s improvement, which also decreases the difficulties and allows for quicker, higher quality software delivery.

DORA Metrics for DevOps Performance Tracking

DORA Metrics for DevOps Performance Tracking
INTRODUCTION TO DORA METRICS:
This blog is to explain the DevOps Research and Assessment capabilities to understand delivery and operational performance for better organizational performance.
DORA — DORA (DevOps Research and Assessment) metrics help us to measure the DevOps performance if there are low or elite performers. The four metrics used are deployment frequency (DF), lead time for changes (LT), mean time to recovery (MTTR), and change failure rate (CFR).

The four essentials of DORA metrics:

  1. Deployment frequency
  2. Lead time for changes
  3. Mean time to recovery
  4. Change failure rate


Deployment Frequency :

Deploy frequency measures how often you deploy changes to a given target environment. Along with Change lead time, Deploy frequency is a measure of speed.

Deployment Frequency also provides us with Batch Size Breakdowns,

Allowing you to filter the code changes based on Small batch, Medium, Large, and Gigantic batch sizes.

  1. Small — usually 1 pull request, 1–10 commits, and a few hundred lines of code changed
  2. Medium — usually 1–2 pull requests, 10–30 commits, and many hundreds of lines of code changed
  3. Large — usually 2–4 pull requests, 20–40 commits, and many hundreds of lines of code changed
  4. Gigantic — usually 4 or more pull requests or 30 or more commits or many thousands of lines of code changed.
Lead Time for Change:

Change lead time measures the time it takes for a change to go from its initial start of coding to being deployed in its target environment. Like Deploy frequency, Change lead time is a measure of speed (whereas Change failure rate and MTTR are measures of quality or stability).

In addition to the Lead Time for Change, Sleuth provided us with a detailed breakdown of how much time your teams, on average, are spending.

  • Coding — the time spent from the first commit (or the time spent from the first transition of an issue to an “in-progress state) to when a pull request is opened
  • Review lag time — the time spent between a pull request being opened and the first review
  • Review time — the time spent from the first review to the pull request being merged
  • Deploying — the time spent from pull request merge to deployment
Mean Time to Recovery:

Change failure rate measures the percentage of deployed changes that cause their target environments to end up in a state of failure. Along with MTTR, Change failure rate is a measure of the quality, or stability of your software delivery capability.

Change Failure Rate

Measures the quality and stability while deployment frequency and Lead Time for Changes don’t indicate the quality of the software but just the velocity of the delivery.

Here’s a table of how DORA metrics are calculated depending on the deployment that occurred, coding and review time, time is taken to restore from an incident or a failure, and failure rate that occurred due to the deployments.

Apart from the four metrics of DORA, there is a fifth one, Reliability, happens to be most important when it comes to operational performance which brings together DevOps and SRE teams to build us a better infrastructure and software. The Reliability metrics is a great way to showcase a team’s overall software delivery performance.

Become an Elite :

According to the most recent State of DevOps report, elite performers have recently grown to now represent 20% of survey respondents. High performers represent 23%, medium performers represent 44%, and low performers only represent 12%.

CONCLUSION :

DORA metrics are a great way to measure the performance of your software development and deployment practices. DORA metrics can help organizations to measure software delivery and stability to a team’s improvement, which also decreases the difficulties and allows for quicker, higher quality software delivery.

Related Blogs

No Related Blog Available

The Ankercloud Team loves to listen