Resources
The latest industry news, interviews, technologies and resources.
DevOps Trends: CI/CD Automation
CI/CD (Continuous Integration/Continuous Delivery) automation is a crucial aspect of DevOps practices and has been gaining significant attention in recent years. By automating the CI/CD pipeline, organizations can accelerate software delivery, improve code quality, and enhance collaboration between development and operations teams. Here are some notable trends in CI/CD automation:
- Shift-Left Testing: Shift-left testing emphasizes early and continuous testing throughout the software development lifecycle, starting from the earliest stages of development. By integrating testing into the CI/CD pipeline and automating the testing process, organizations can identify and address issues more quickly, reducing the risk of defects reaching production.
- Infrastructure as Code (IaC): Infrastructure as Code is a practice that enables the automation and management of infrastructure resources using code. With IaC, infrastructure configurations can be version-controlled, tested, and deployed alongside application code. CI/CD automation tools integrate with IaC frameworks such as Terraform or AWS CloudFormation to provision and manage infrastructure resources in a consistent and repeatable manner.
- Cloud-Native CI/CD: As organizations increasingly adopt cloud computing and containerization technologies, CI/CD pipelines are evolving to support cloud-native applications. Tools like Kubernetes and Docker are commonly used to build, deploy, and orchestrate containerized applications. CI/CD automation platforms are adapting to support the unique requirements of cloud-native environments, enabling seamless integration with container registries, orchestrators, and serverless platforms.
- Machine Learning/AI in CI/CD: Machine learning and AI techniques are being applied to CI/CD automation to optimize various aspects of the software delivery process. For example, AI-based algorithms can analyze code quality, identify patterns, and provide recommendations for improvements. Machine learning models can also be used to predict and detect anomalies in CI/CD pipelines, enabling proactive identification of potential issues.
- Low-Code/No-Code CI/CD: The rise of low-code/no-code development platforms has extended to CI/CD automation as well. These platforms provide visual interfaces and pre-built integrations that simplify the setup and configuration of CI/CD pipelines, reducing the need for extensive coding or scripting. Low-code/no-code CI/CD tools empower non-technical stakeholders to participate in the automation process and accelerate the delivery of applications.
Benefit of CI/CD: -
· Increased delivery speed & cooperation
· Instantaneous feedback
· Simple to maintain & Reliable
Components of a CI/CD Pipeline: -
a. Jenkins Pipeline: Jenkins Pipeline is a powerful and flexible way to define your continuous integration and continuous delivery (CI/CD) workflows in Jenkins. It allows you to define your build, test, and deployment stages as code, providing a consistent and repeatable process for your software development lifecycle. Jenkins Pipeline supports two syntaxes: Declarative Pipeline and Scripted Pipeline.
i. Declarative Pipeline: Declarative Pipeline provides a more structured and opinionated syntax for defining pipelines. It is recommended for most use cases as it offers simplicity and readability. Here’s an example of a simple Declarative Pipeline:
pipeline { agent any
stages { stage(‘Build’) { steps { // Perform the build steps here } }
stage(‘Test’) { steps { // Run your tests here } }
stage(‘Deploy’) { steps { // Deploy your application here }}}}
In this example, the pipeline has three stages: “Build,” “Test,” and “Deploy.” Each stage contains the necessary steps to be executed.
ii. Scripted Pipeline: Scripted Pipeline provides a more flexible and programmatic way to define your pipelines using Groovy scripting. It allows you to have greater control over the execution flow and provides more advanced features. Here’s an example of a simple Scripted Pipeline:
node {
stage(‘Build’) { // Perform the build steps here}
stage(‘Test’) { // Run your tests here }
stage(‘Deploy’) { // Deploy your application here }}
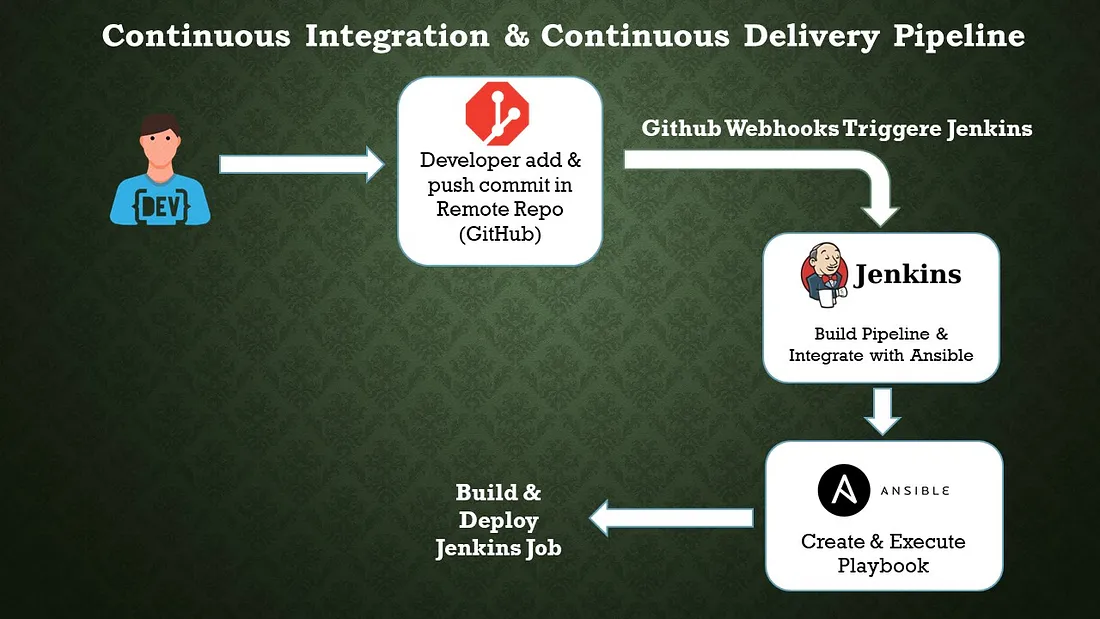
b. Configuration Management Tool: Ansible
Ansible is an open-source configuration management tool that automates the deployment, orchestration, and management of software applications and infrastructure. It is designed to be simple, agentless, and easy to use, making it popular among system administrators and DevOps teams. Here are some key features and concepts related to Ansible:
i. Agentless: Ansible does not require any agents or additional software to be installed on the target systems. It uses SSH (Secure Shell) and Python to communicate with remote hosts, which simplifies the setup process and reduces the overhead on managed systems.
ii. Declarative Language: Ansible uses a YAML-based language called Ansible Playbooks to define configurations and automate tasks. Playbooks are human-readable and describe the desired state of the systems. This declarative approach allows for idempotent execution, where running the same playbook multiple times produces consistent results.
iii. Inventory: Ansible uses an inventory file to define the hosts or systems it manages. The inventory can be a static file or generated dynamically from various sources, such as cloud providers or external scripts. It allows you to organize hosts into groups and apply different configurations to specific groups or individual hosts.
iv. Modules: Ansible comes with a wide range of built-in modules that perform specific tasks, such as managing packages, configuring services, manipulating files, or executing commands. Modules are written in Python and can be extended or customized to meet specific requirements.
v. Playbooks: Playbooks are the heart of Ansible. They are YAML files that define a set of tasks to be executed on remote hosts. Playbooks specify the desired state of the systems, and Ansible takes care of bringing them into that state. Playbooks can include variables, conditionals, loops, and handlers to perform complex configuration management.
vi. Idempotency: Ansible’s idempotent nature ensures that running the same playbook multiple times does not cause unintended changes. If a system is already in the desired state, Ansible skips the corresponding tasks, resulting in a consistent and reliable configuration management process.
vii. Ad-hoc Commands: Ansible allows you to execute ad-hoc commands directly on remote hosts without the need for writing a playbook. This feature is useful for quick troubleshooting, one-time tasks, or running simple commands across multiple systems simultaneously.
viii. Ansible Galaxy: Ansible Galaxy is a hub for sharing and discovering Ansible roles. Roles provide a way to organize and reuse playbook logic, making it easier to manage complex configurations. Ansible Galaxy allows you to find pre-built roles contributed by the community, helping you accelerate your automation efforts.
Conclusion:
Code quality is increased and changes are provided rapidly with CI/CD automation. The automation technique has a very good quality, bug-free, and quicker fault isolation impact. We completed every step of the automation process, including create, build, test, and deliver. Process automation is necessary for software development.
DORA Metrics for DevOps Performance Tracking
INTRODUCTION TO DORA METRICS:
This blog is to explain the DevOps Research and Assessment capabilities to understand delivery and operational performance for better organizational performance.
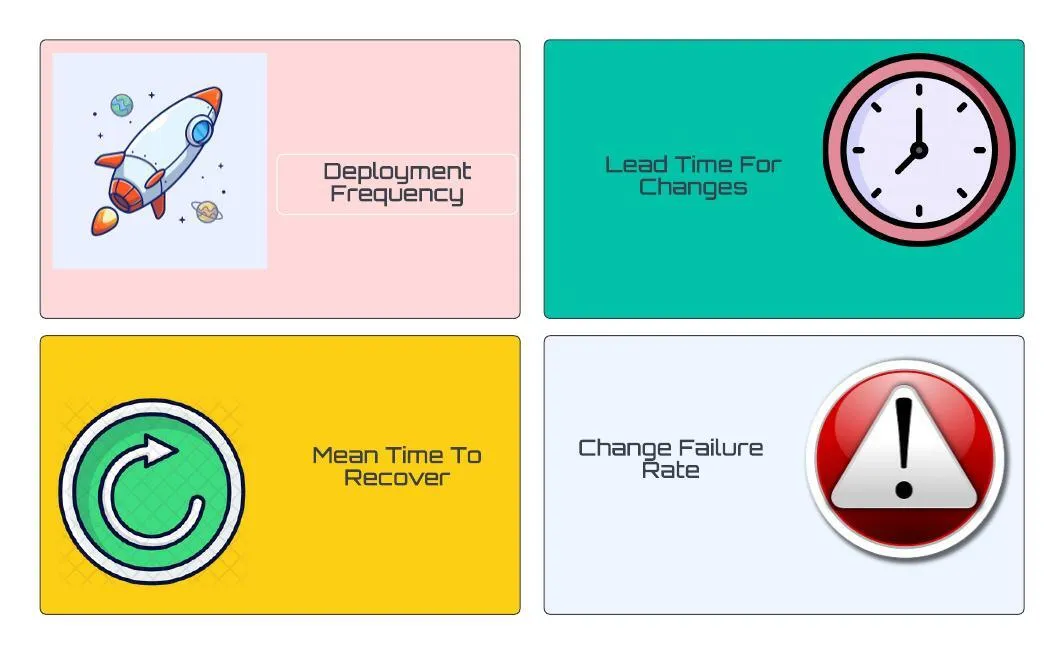
DORA — DORA (DevOps Research and Assessment) metrics help us to measure the DevOps performance if there are low or elite performers. The four metrics used are deployment frequency (DF), lead time for changes (LT), mean time to recovery (MTTR), and change failure rate (CFR).
The four essentials of DORA metrics:
- Deployment frequency
- Lead time for changes
- Mean time to recovery
- Change failure rate
Deployment Frequency :
Deploy frequency measures how often you deploy changes to a given target environment. Along with Change lead time, Deploy frequency is a measure of speed.
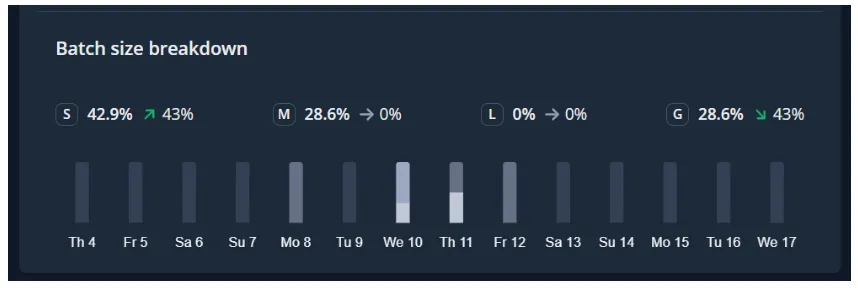
Deployment Frequency also provides us with Batch Size Breakdowns,
Allowing you to filter the code changes based on Small batch, Medium, Large, and Gigantic batch sizes.
- Small — usually 1 pull request, 1–10 commits, and a few hundred lines of code changed
- Medium — usually 1–2 pull requests, 10–30 commits, and many hundreds of lines of code changed
- Large — usually 2–4 pull requests, 20–40 commits, and many hundreds of lines of code changed
- Gigantic — usually 4 or more pull requests or 30 or more commits or many thousands of lines of code changed.
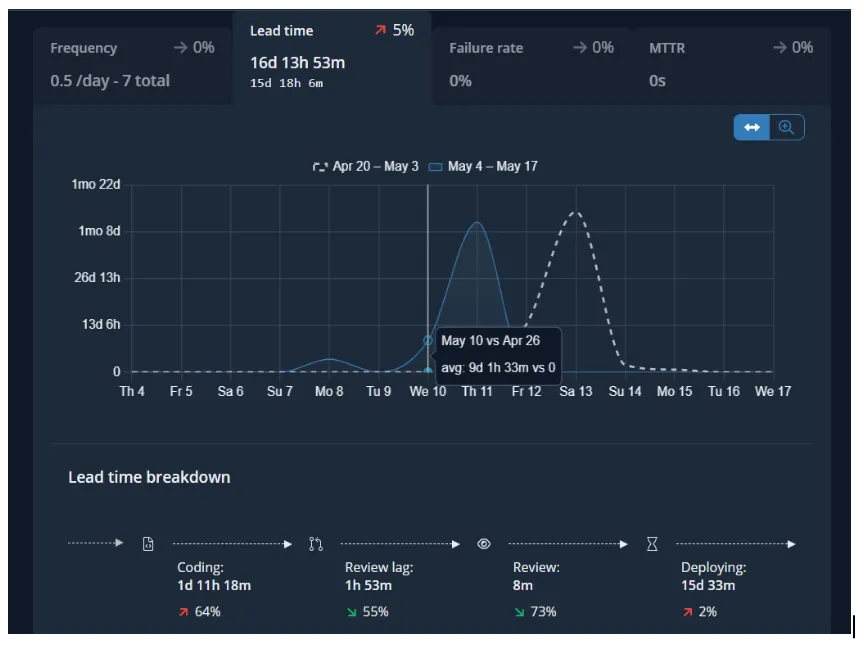
Lead Time for Change:
Change lead time measures the time it takes for a change to go from its initial start of coding to being deployed in its target environment. Like Deploy frequency, Change lead time is a measure of speed (whereas Change failure rate and MTTR are measures of quality or stability).
In addition to the Lead Time for Change, Sleuth provided us with a detailed breakdown of how much time your teams, on average, are spending.
- Coding — the time spent from the first commit (or the time spent from the first transition of an issue to an “in-progress state) to when a pull request is opened
- Review lag time — the time spent between a pull request being opened and the first review
- Review time — the time spent from the first review to the pull request being merged
- Deploying — the time spent from pull request merge to deployment
Mean Time to Recovery:
Change failure rate measures the percentage of deployed changes that cause their target environments to end up in a state of failure. Along with MTTR, Change failure rate is a measure of the quality, or stability of your software delivery capability.
Change Failure Rate
Measures the quality and stability while deployment frequency and Lead Time for Changes don’t indicate the quality of the software but just the velocity of the delivery.
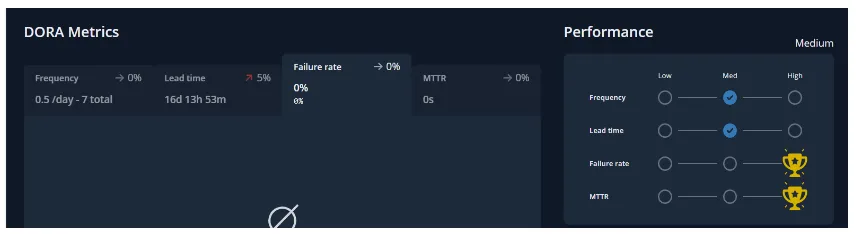
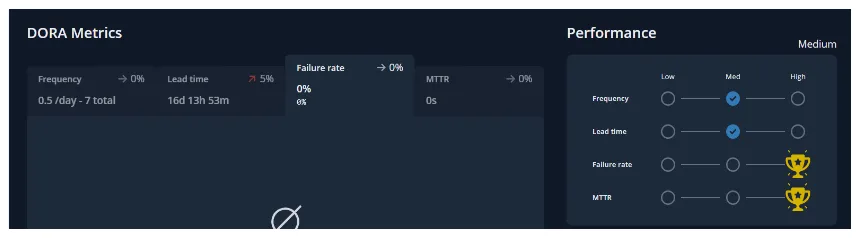
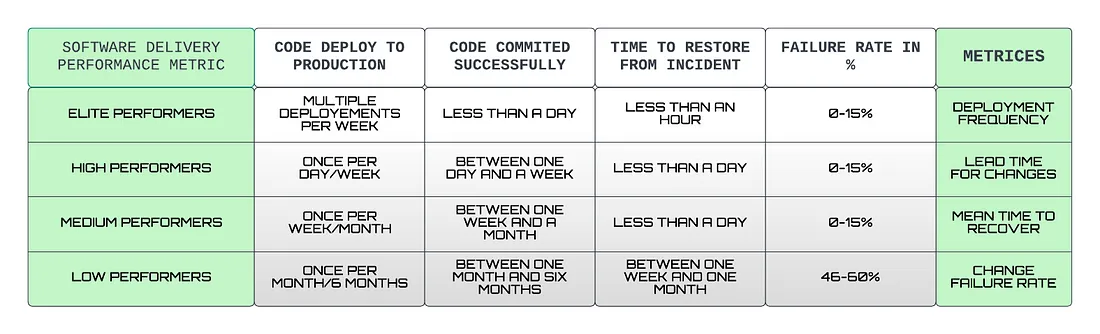
Here’s a table of how DORA metrics are calculated depending on the deployment that occurred, coding and review time, time is taken to restore from an incident or a failure, and failure rate that occurred due to the deployments.
Apart from the four metrics of DORA, there is a fifth one, Reliability, happens to be most important when it comes to operational performance which brings together DevOps and SRE teams to build us a better infrastructure and software. The Reliability metrics is a great way to showcase a team’s overall software delivery performance.
Become an Elite :
According to the most recent State of DevOps report, elite performers have recently grown to now represent 20% of survey respondents. High performers represent 23%, medium performers represent 44%, and low performers only represent 12%.
CONCLUSION :
DORA metrics are a great way to measure the performance of your software development and deployment practices. DORA metrics can help organizations to measure software delivery and stability to a team’s improvement, which also decreases the difficulties and allows for quicker, higher quality software delivery.
Setup of Custom CloudWatch Metrics on your Linux EC2 instance
Amazon CloudWatch can load all the metrics in your account (both AWS resource metrics and application metrics that you provide) for search, graphing, and alarms. Metric data is kept for 15 months, enabling you to view both up-to-the-minute data and historical data.
The CloudWatch monitoring provide some basic monitoring which can be configures in some clicks, while if you want to monitor custom metrics such as the disk and memory utilization of your EC2 machine you should have to follow these steps.
Steps to configure CloudWatch Metrics on Linux Machine:
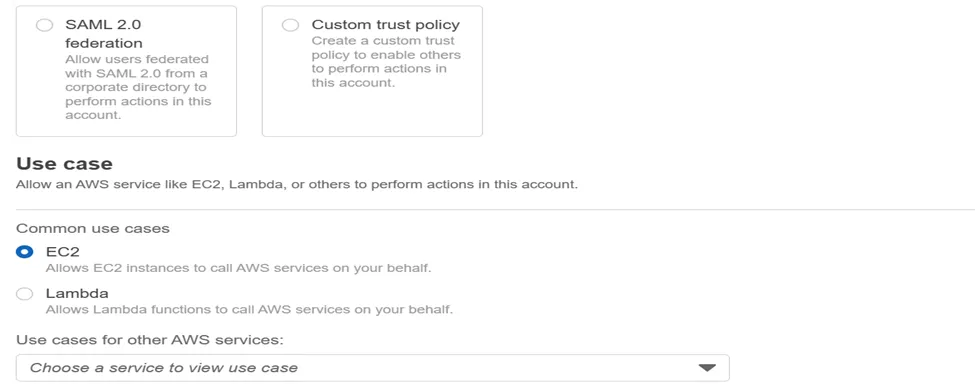
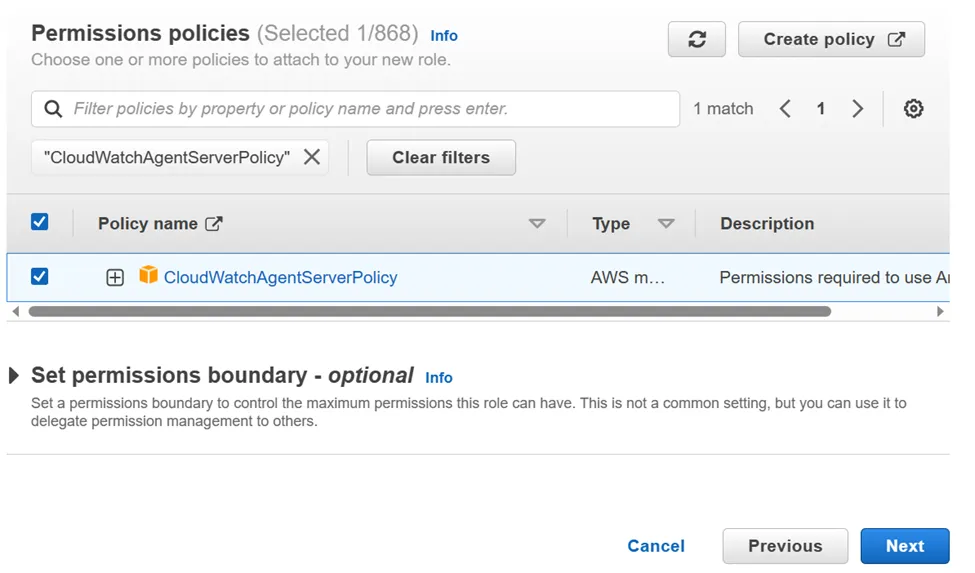
- Go to AWS Console-> Go To IAM -> Go to Role-> create Role-> Attach CloudWatchAgentServerPolicy -> click next-> Give Role Name-> click create role
2. Attach created role to the EC2 instance on which you want to do configuration of CloudWatch Metrics.
Go to EC2-> Go to Security-> Go to Modify IAM Role-> Select the Role Name-> click on update IAM Role
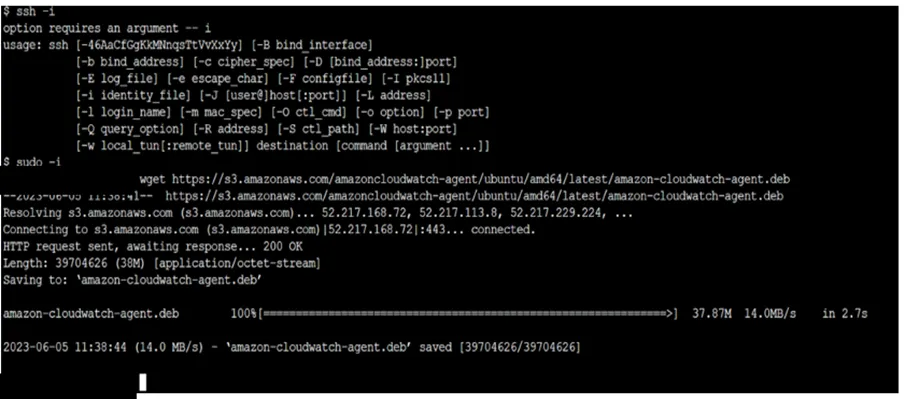
3. SSH into Your EC2 instance and apply following Commands
i. wget https://s3.amazonaws.com/amazoncloudwatch-agent/ubuntu/amd64/latest/amazon-cloudwatch-agent.deb
The command will download CloudWatch Agent on your EC2 machine.
iI. sudo dpkg -i -E ./amazon-cloudwatch-agent.deb
The Command will unzip the installed package
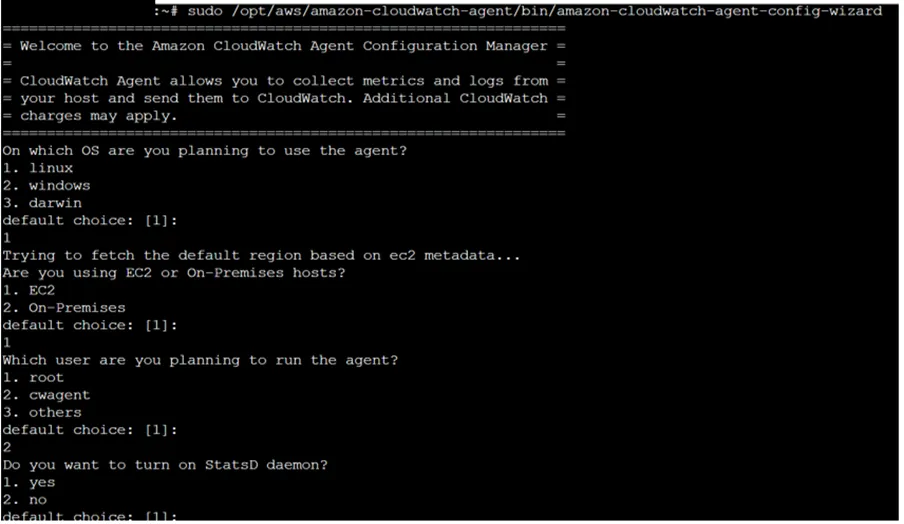
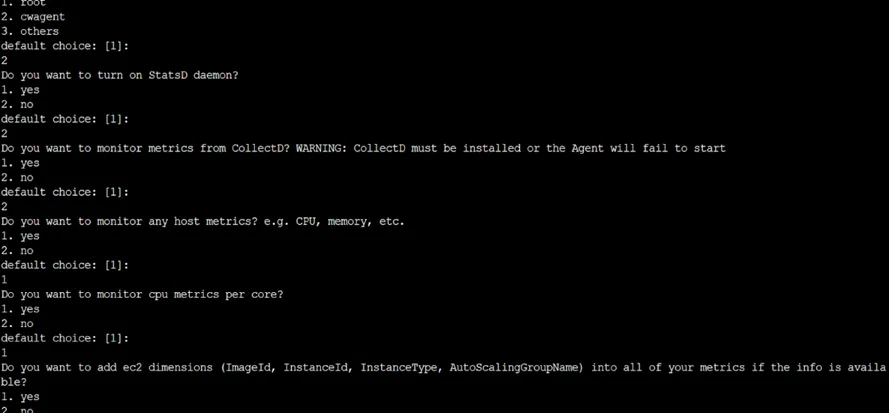
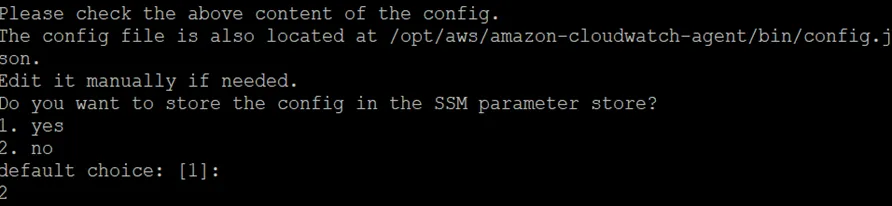
iiI. sudo /opt/aws/amazon-cloudwatch-agent/bin/amazon-cloudwatch-agent-config-wizard
The Command start installation of CloudWatch Agent
iv. sudo /opt/aws/amazon-cloudwatch-agent/bin/amazon-cloudwatch-agent-ctl -a fetch-config -m ec2 -c file:/opt/aws/amazon-cloudwatch-agent/bin/config.json -s
The Command will run the AWS CloudWatch Agent
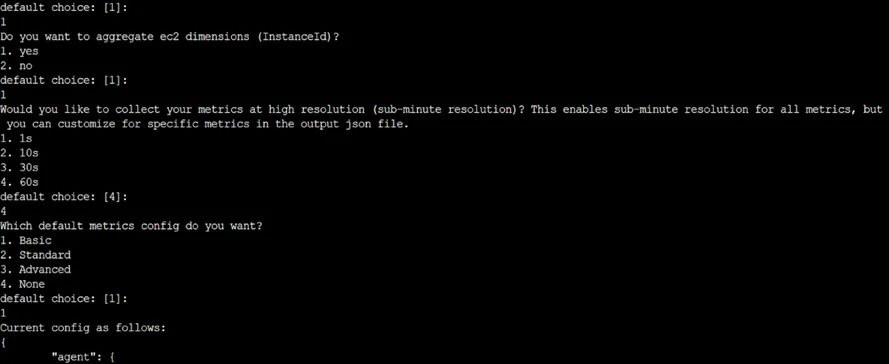
v. sudo /opt/aws/amazon-cloudwatch-agent/bin/amazon-cloudwatch-agent-ctl -a status
The Command Will start the AWS CloudWatch Configuration as per selected Settings.
4. Now monitor the instance from CloudWatch Console.
5. Go to the cloudwatch dashboard->click on all Metrics-> click on cwagent-> click on InstanceId
6. Select Metrics which utilization you want to check
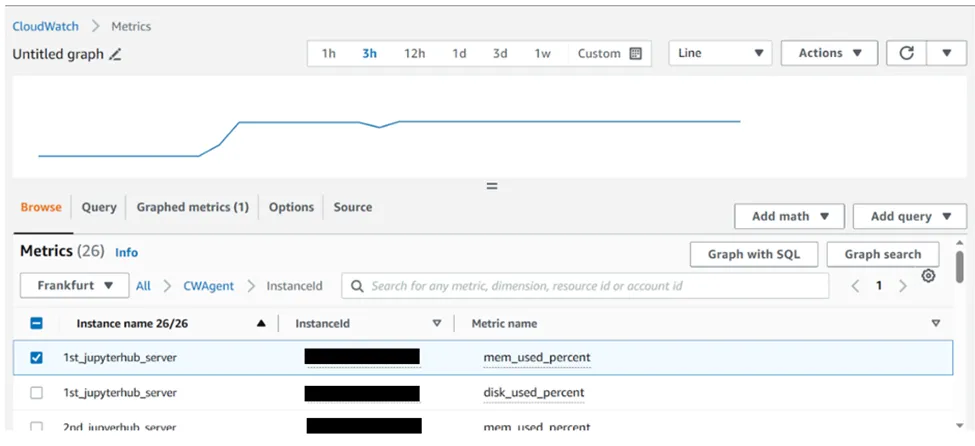
7. This is how you can check the memory, disk and CPU utilization of your EC2 instance.
Kubeflow on AWS
What is Kubeflow?
The Kubeflow project aims to simplify, portability, and scalability of machine learning (ML) workflow deployments on Kubernetes. Our objective is to make it simple to deploy best-of-breed open-source ML systems to a variety of infrastructures, not to replicate other services. Run Kubeflow wherever Kubernetes is installed and configured.
Need of Kubeflow?
The need for Kubeflow arises from the challenges of building, deploying, and managing machine learning workflows at scale. By providing a scalable, portable, reproducible, collaborative, and automated platform, Kubeflow enables organizations to accelerate their machine learning initiatives and improve their business outcomes.
Here are some of the main reasons why Kubeflow is needed:
Scalability: Machine learning workflows can be resource-intensive and require scaling up or down based on the size of the data and complexity of the model. Kubeflow allows you to scale your machine learning workflows based on your needs by leveraging the scalability and flexibility of Kubernetes.
Portability: Machine learning models often need to be deployed across multiple environments, such as development, staging, and production. Kubeflow provides a portable and consistent way to build, deploy, and manage machine learning workflows across different environments.
Reproducibility: Reproducibility is a critical aspect of machine learning, as it allows you to reproduce results and debug issues. Kubeflow provides a way to reproduce machine learning workflows by using containerization and version control.
Collaboration: Machine learning workflows often involve collaboration among multiple teams, including data scientists, developers, and DevOps engineers. Kubeflow provides a collaborative platform where teams can work together to build and deploy machine learning workflows.
Automation: Machine learning workflows involve multiple steps, including data preprocessing, model training, and model deployment. Kubeflow provides a way to automate these steps by defining pipelines that can be executed automatically or manually.
Architecture Diagram:
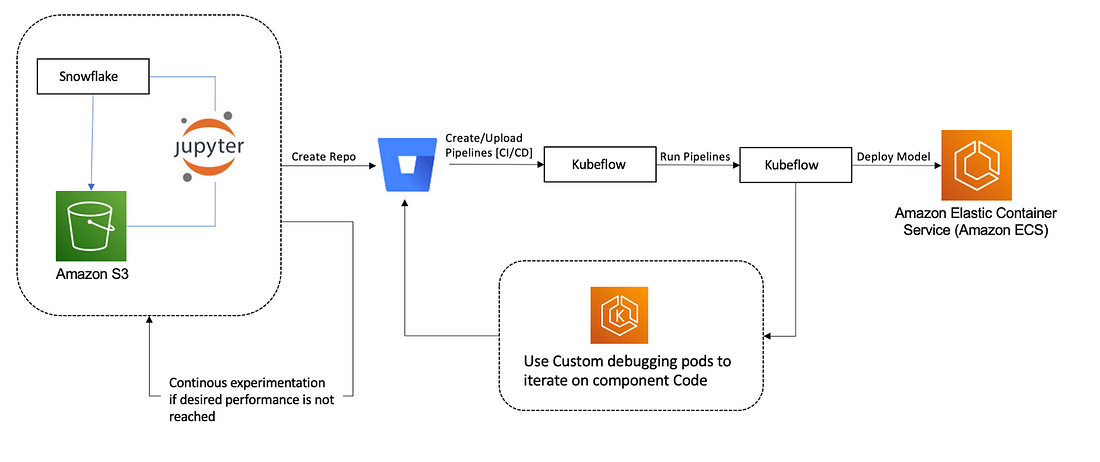
What does Kubeflow do?
Kubeflow provides a range of tools and frameworks to support the entire ML workflow, from data preparation to model training to deployment and monitoring. Here are some of the key components of Kubeflow:
Jupyter Notebooks: Kubeflow includes a Jupyter Notebook server that allows users to run Python code interactively and visualize data in real-time.
TensorFlow: Kubeflow includes TensorFlow, a popular open-source ML library, which can be used to train and deploy ML models.
TensorFlow Extended (TFX): TFX is an end-to-end ML platform for building and deploying production ML pipelines. Kubeflow integrates with TFX to provide a streamlined way to manage ML pipelines.
Katib: Kubeflow includes Katib, a framework for hyperparameter tuning and automated machine learning (AutoML).
Kubeflow Pipelines: Kubeflow Pipelines is a tool for building and deploying ML pipelines. It allows users to define complex workflows that can be run on a Kubernetes cluster.
What is Amazon SageMaker?
Amazon SageMaker is a fully-managed machine learning service that enables data scientists and developers to build, train, and deploy machine learning models at scale. Kubeflow, on the other hand, is an open-source machine learning platform that provides a framework for running machine learning workflows on Kubernetes.
Using Amazon SageMaker with Kubeflow can help streamline the machine learning workflow by providing a unified platform for model development, training, and deployment. Here are the key steps to using Amazon SageMaker with Kubeflow:
Set up a Kubeflow cluster on Amazon EKS or other Kubernetes platforms.
● Install the Amazon SageMaker operator in your Kubeflow cluster. The operator provides a custom resource definition (CRD) that allows you to create and manage SageMaker resources within your Kubeflow environment.
● Use the SageMaker CRD to create SageMaker resources such as training jobs, model endpoints, and batch transform jobs within your Kubeflow cluster.
● Run your machine learning workflow using Kubeflow pipelines, which can orchestrate SageMaker training jobs and other components of the workflow.
● Monitor and manage your machine learning workflow using Kubeflow’s web-based UI or command-line tools.
● By integrating Amazon SageMaker with Kubeflow, you can take advantage of SageMaker’s powerful features for model training and deployment, while also benefiting from Kubeflow’s flexible and scalable machine learning platform.
Amazon SageMaker Components for Kubeflow Pipelines:
Component 1: Hyperparameter tuning job
The first component runs an Amazon SageMaker hyperparameter tuning job to optimize the following hyperparameters:
· learning-rate — [0.0001, 0.1] log scale
· optimizer — [sgd, adam]
· batch-size– [32, 128, 256]
· model-type — [resnet, custom model]
Component 2: Selecting the best hyperparameters
During the hyperparameter search in the previous step, models are only trained for 10 epochs to determine well-performing hyperparameters. In the second step, the best hyperparameters are taken and the epochs are updated to 80 to give the best hyperparameters an opportunity to deliver higher accuracy in the next step.
Component 3: Training job with the best hyperparameters
The third component runs an Amazon SageMaker training job using the best hyperparameters and for higher epochs.
Component 4: Creating a model for deployment
The fourth component creates an Amazon SageMaker model artifact.
Component 5: Deploying the inference endpoint
The final component deploys a model with Amazon SageMaker deployment.
Conclusion:
Kubeflow is an open-source platform that provides a range of tools and frameworks to make it easier to run ML workloads on Kubernetes. With Kubeflow, you can easily build and deploy ML models at scale, while also benefiting from the scalability, flexibility, and reproducibility of Kubernetes.
Monitoring AWS EKS cluster using AWS Prometheus (AMP) & AWS Grafana (AMG)
Amazon Managed Prometheus is a fully managed backend to ingest, query metrics, store, and visualizes data using Grafana. It is highly scalable, has fast, and secure access to data, and has a unified way of monitoring all containerized applications like AWS EKS.
Amazon Managed Grafana we can be able to create Grafana dashboards and visualizations to analyze your metrics, and logs, and trace our applications. Here would be able to perform native Prometheus Query Language (PromQL) to query the metrics to analyze the data of our Kubernetes cluster.
CREATING AWS PROMETHEUS AND GRAFANA STEPS
Step 1: Create an EKS cluster with a node group
Step 2: Create a workspace in the AWS Prometheus


Mark down the Workspace ID and Endpoint-query URL this will require later.
Step 3: Setting up the Prometheus server in our Kubernetes.
Prometheus server helps to collect all the cluster metrics which is inside our EKS cluster then it will transfer to AMP.
3.1) Execute the following helm commands to add charts
Kubernetes Monitoring with Datadog
Introduction
Kubernetes monitoring is crucial for ensuring the optimal performance, availability, and reliability of your containerized applications running in a Kubernetes cluster. With the complexity and scale of Kubernetes deployments, effective monitoring becomes essential for identifying and resolving issues quickly. Datadog, a popular monitoring platform, provides comprehensive Kubernetes monitoring capabilities. It offers real-time visibility into the health and performance of your cluster, including metrics, logs, and traces. With Datadog, you can gain insights into resource utilization, application performance, and container orchestration. This enables proactive troubleshooting, efficient resource allocation, and effective capacity planning, ensuring the smooth operation of your Kubernetes environment and facilitating application scalability and stability.
1. Prerequisite.
. Install Datadog Agent on EKS
• Install Datadog Cluster Agent
• Configure permissions and secrets
a. Creating ClusterRole, ClusterRoleBinding, and ServiceAccount for allowing permission to cluster agent and datadog agent to collect metrices.
• Creating Kubernetes Secret to provide your Datadog API key
• Deploy the datadog-cluster-agent and datadog-agent on EKS using yaml files. (datadog-cluster-agent.yaml, datadog-agent.yaml.)
Install Datadog Agent on EKS:-
The Datadog Agent is free software that enables you to observe and manage your complete infrastructure in one location by gathering metrics, distributed traces, and logs from each of your nodes and reporting them.
The Agent automatically gathers and provides resource measurements (such as CPU, memory, and network traffic) from your nodes, regardless of the underlying infrastructure platform, in addition to gathering telemetry data from Kubernetes, Docker, and other infrastructure technologies.
Install Datadog Cluster Agent:-
By acting as a proxy between the API server and the node-based Agents, the Datadog Cluster Agent reduces the load on the Kubernetes API server for collecting cluster-level data. It also adds security by lowering the permissions required for the node-based Agents, and it allows Kubernetes workloads to be automatically scaled using any metric that Datadog collects.
Configure permissions and secrets:-
The following manifests can be deployed to create the permissions that the node-based Agent and Cluster Agent will need to function in your Kubernetes cluster if it implements role-based access control. The following manifests provide two sets of permissions: one for the node-based Agent and one for the cluster agent. The cluster agent has rights specifically for gathering cluster-level metrics and Kubernetes events via the Kubernetes API. For each type of Agent, deploying these two manifests will result in the creation of a ClusterRole, ClusterRoleBinding, and ServiceAccount.
2. Tasks To Do.
The Github repository URL is below. In that repository, you can find the configuration file. You must run that file on the EKS Cluster so that the node-based Agent and Cluster Agent may conduct tasks.
https://github.com/frankisinfotech/Datadog-monitoring
kubectl create -f https://raw.githubusercontent.com/DataDog/datadog-agent/master/Dockerfiles/manifests/cluster-agent/cluster-agent-rbac.yaml
kubectl create -f https://raw.githubusercontent.com/DataDog/datad og-agent/master/Dockerfiles/manifests/cluster-agent/rbac.yaml
Create a Kubernetes secret next so you may give the Agent your Datadog API key without include it in your deployment manifests.
kubectl create secret generic datadog-secret — from-literal api-key=”<YOUR_API_KEY>”
In order to provide secure Agent-to-Agent communication between the Cluster Agent and the node-based Agents, construct a secret token as follows:
Create a 32-bit long string using the link below, then use it in the command below.
echo -n <32 String long password> | base64
Use the resulting token to create a Kubernetes secret that both flavors of Agent will use to authenticate with each other:
Use the token in below command which is generated from above command.
Kubectl create secret generic datadog-auth-token –from literal=token=<TOKEN_FROM_PREVIOUS_STEP>
Deploy the Cluster Agent:-
You’re prepared to deploy the Cluster Agent now that you’ve created Kubernetes secrets using your Datadog API key and an authentication token. Copy the manifest file from the aforementioned Gitub repo link to your local computer and save it there as datadog-cluster-agent.yaml:

After copy that file to local you have to run that file on cluster so it will deploy that cluster agent on node, so use below command to deploy agent.
kubectl apply -f datadog-cluster-agent.yaml
For the Cluster Agent, the manifest establishes a Kubernetes deployment and service. The Service offers a consistent endpoint within the cluster so that node-based Agents can communicate with the Cluster Agent, wherever it may be running, while the Deployment ensures that a single Cluster Agent is always running somewhere in the cluster. It should be noted that rather than being saved in plaintext in the manifest itself, the Datadog API key and authentication token are obtained through Kubernetes secrets.
check the status of cluster agent using below command:
kubectl get pods -l app=datadog-cluster-agent

Deploy the node-based Agent:
The node-based Datadog Agent is easy to install to your cluster once the required permissions and secrets have been generated. DD_CLUSTER_AGENT_ENABLED (set to true) and DD_CLUSTER_AGENT_AUTH_TOKEN (set using Kubernetes secrets, much like in the Cluster Agent manifest) are two additional environment variables that are set in the manifest that follows the normal Kubernetes Agent manifest. Save the following manifest as datadog-agent.yaml and copy it to a local file.

Similar to the previous cluster agent, you must copy the datadog-agent file to local storage before deploying the datadog agent on the cluster. Once the node-based Agent is deployed as a DaemonSet, use the following command to make sure that one instance of the Agent is running on each node in the cluster.
kubectl apply -f -f datadog-agent.yaml
To verify that the node-based Datadog Agent is running on your cluster, run the following command:
kubectl get daemonset datadog-agent
After this all the configuration you will be able to see the resources and metrices in the datadog console.
Dive into the metrics
The resource measurements and events from your cluster should be streaming into Datadog after the Datadog Agent has been successfully deployed. The built-in Kubernetes dashboard allows you to view the data you’ve already started gathering.
You might remember from earlier in this series that an optional cluster add-on called kube-state-metrics offers specific cluster-level metrics, more specifically the counts of Kubernetes objects like the count of desired, available, and unavailable pods. If you notice that this information is missing from the dashboard, it indicates that the kube-state-metrics service has not yet been installed. You only need to deploy kube-state-metrics to your cluster to start collecting these statistics in addition to the lower-level resource metrics that the Agent already gathers.
Deploy kube-state-metrics
You may rapidly deploy the add-on and its related resources by using a set of manifests from the official kube-state-metrics project, as was discussed in Part 3 of this series. Run the following commands to get the manifests and apply them to your cluster:
git clone https://github.com/kubernetes/kube-state-metrics.git
cd kube-state-metrics
kubectl apply -f examples/standard
Below are the screenshots from datadog console.

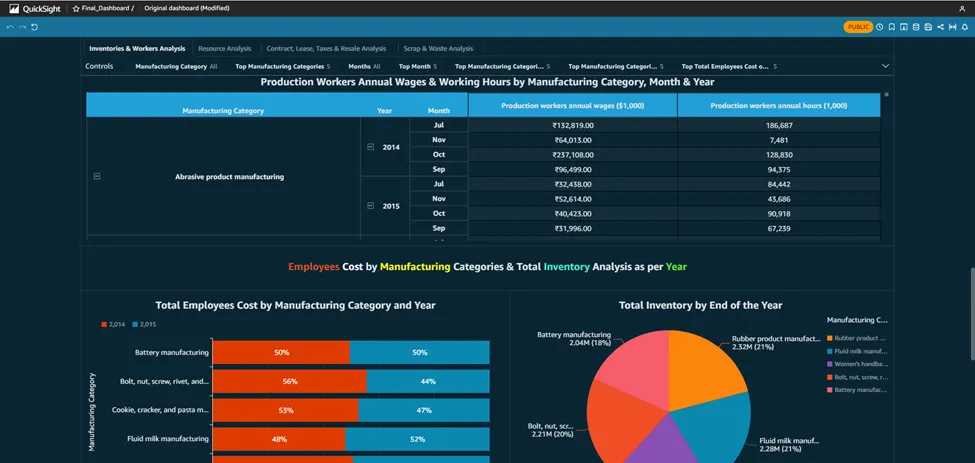
Create dashboards on AWS QuickSight & make it accessible publicly on the internet
Amazon Quicksight powers data-driven organizations with unified business intelligence (Bi) at hyperscale. With the Quicksight, all users can meet varying analytic needs from the same source of truth through modern interactive dashboards, paginated reports, embedded analytics and natural language queries.
Benefits of AWS QuickSight :-
Build faster : Speed up the development by using one authoring experience to build modern dashboards and reports. Developers can quickly integrate rich analytics and ML-powered natural language query capabilities into applications with one-step, public embedding and rich APIs.
Low cost : Pay for what you use with the quicksight usage-based pricing. No need to buy thousands of end-user licenses for large scale Bi/embedded analytics deployments. With no servers or software to install or manage. Also can lower costs by removing upfront costs and complex capacity planning.
BI for everyone : Deliver insights to all your users when, where and how they need them. Users can explore modern & interactive dashboards, get insights within their applications, obtain scheduled formatted reports with reports and make decisions with ML insights.
Scalable : Quicksight is serverless, it automatically scale to tens of thousands of users without the need to set up, configure or manage your own servers. The Quicksight in-memory calculation engine, SPICE provides consistently fast response times for end users, removing the need to scale databases for high workloads.
Lets Start With QuickSight :-
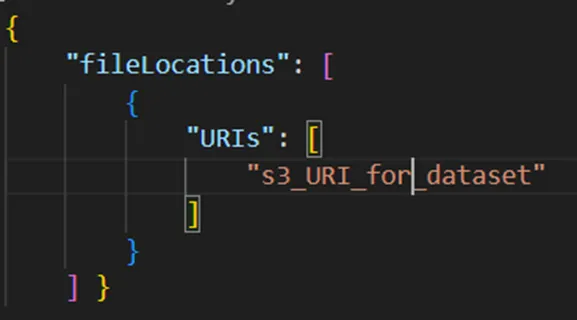
Create a manifest file for uploading the dataset :
· Initially we have uploaded the data & manifest file into AWS S3.
· To create a manifest file you can refer the following.
· We have created a manifest file named manifest.json.
· Navigate to Quicksight in the AWS console.
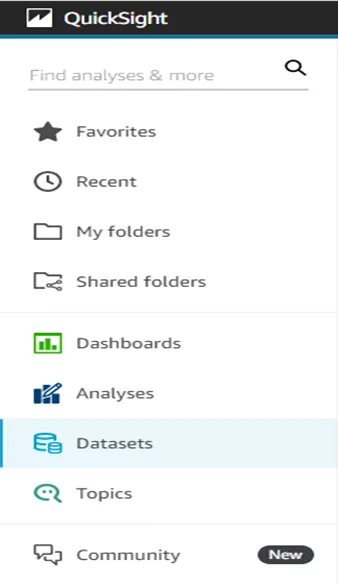
· Select the Datasets from the left side of the console.
· Click on New dataset to upload a new dataset.

· Now you will see the multiple datasources from where you can upload the data into quicksight.
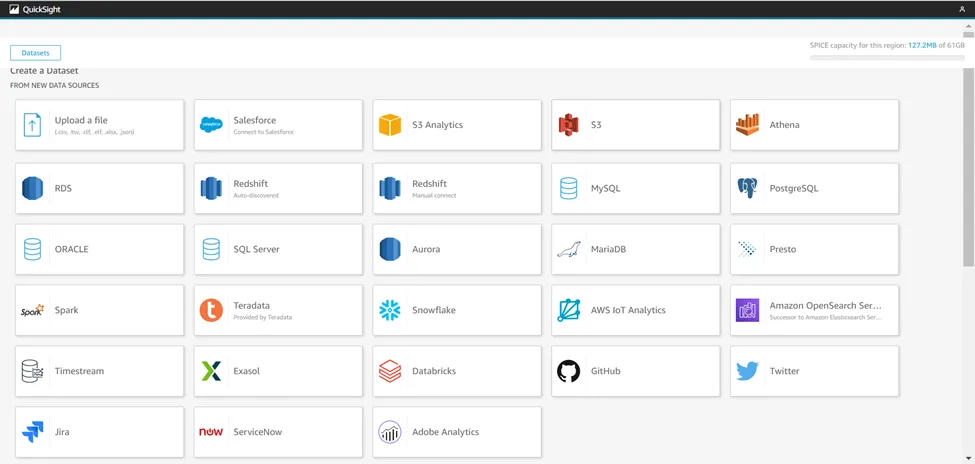
· So we are using S3 for the dataset.
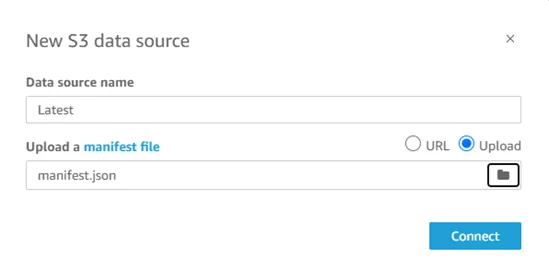
· Name the Dataset and upload the manifest file directly from the local by selecting Upload options or from S3 using URL.
· Click on connect to finish the upload.
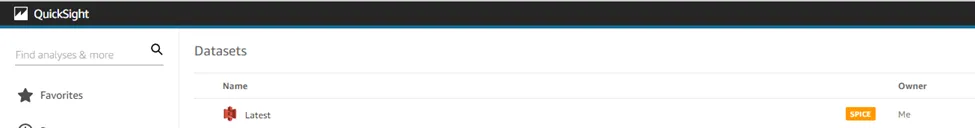
· Here you will get the uploaded dataset which was named Latest.
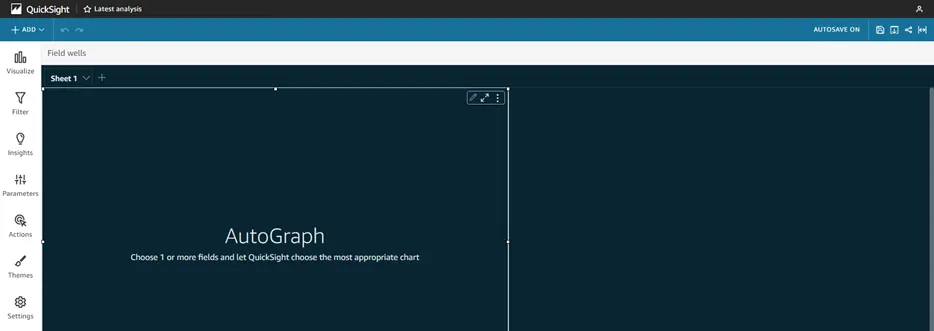
Create a new analysis :
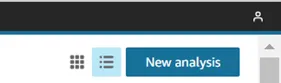
· Click on the Analyses to start the analysis and dashboards.
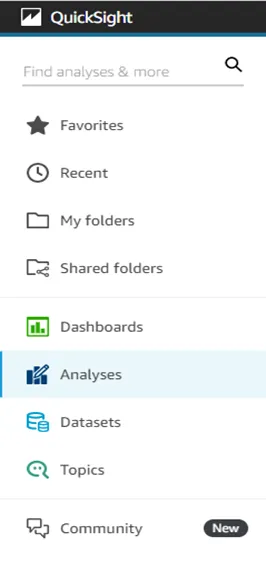
· Click on the New analysis button to start the analysis.
· Here you will be in the analysis, where you can do analysis, make dashboards and visuals.
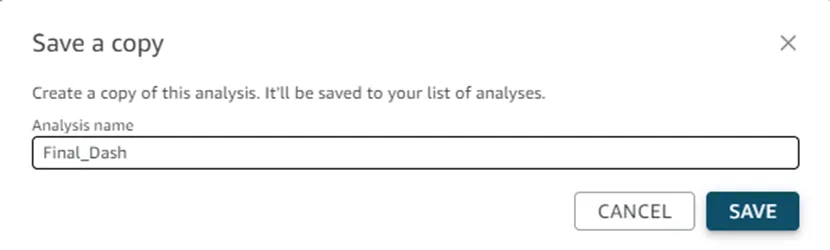
Publish the dashboard and make it publically available :
· First save the analysis.

· Click on the Save icon & name the dashboard, Click on SAVE.
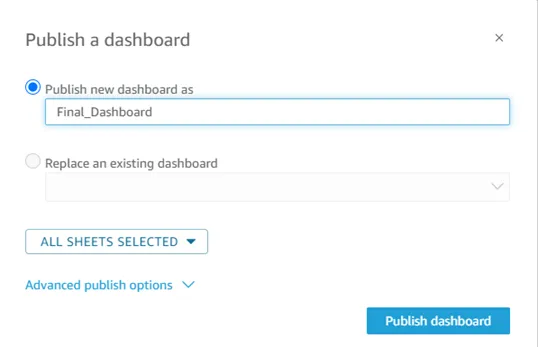
· Now click on the Share icon and select Publish dashboard option as shown below

· Name the dashboard & click on Publish dashboard button.
· Now Click on the share icon and select the Share dashboard option as shown below.

· You will see the option Anyone on the internet (public), just enable it.
· Copy the link by simply clicking on the Copy link.
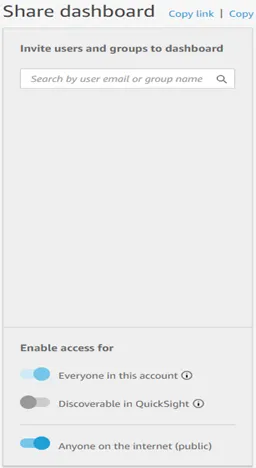
· Paste the copied link in the browser or share it to anyone to see your dashboards.
Understanding DevSecOps Concepts
DevSecOps, which stands for Development, Security, and Operations, is an approach that integrates security practices into the software development process. It emphasizes the collaboration and cooperation between development teams, security teams, and operations teams, with the goal of integrating security measures throughout the entire software development lifecycle.
There are several reasons why organizations adopt DevSecOps:
- Early Detection of Vulnerabilities: By incorporating security practices into the development process from the beginning, DevSecOps enables early detection and remediation of vulnerabilities. Security measures such as code analysis, vulnerability scanning, and penetration testing can be performed during development, reducing the chances of security issues going unnoticed until later stages.
- Rapid and Continuous Delivery: DevSecOps promotes the use of automation, continuous integration, and continuous delivery (CI/CD) pipelines. This approach enables faster and more frequent software releases while maintaining security standards. Security checks and tests can be automated and integrated into the CI/CD pipeline, ensuring that security is not compromised during the fast-paced development and deployment cycles.
- Collaboration and Shared Responsibility: DevSecOps emphasizes collaboration between development, security, and operations teams. It encourages breaking down silos and fostering a shared responsibility for security across different teams. This collaboration ensures that security considerations are not an afterthought but an integral part of the development process, leading to more secure and resilient software.
- Compliance and Regulatory Requirements: Many industries and organizations have stringent compliance and regulatory requirements concerning data protection and security. DevSecOps helps address these requirements by integrating security controls and practices into the development process. By automating security checks and documentation, organizations can demonstrate compliance more efficiently.
- Agile and Adaptive Security: DevSecOps aligns with the agile development methodology, allowing security practices to be implemented in an iterative and adaptive manner. Security measures can be continuously evaluated, improved, and adjusted based on changing threats and vulnerabilities. This enables organizations to respond more effectively to emerging security challenges.
- Enhanced Risk Management: Incorporating security into the development process allows organizations to identify and manage security risks more effectively. By addressing security concerns early on, the overall risk profile of the software can be reduced. DevSecOps provides visibility into potential risks and facilitates risk mitigation strategies.
Benefits of DevSecOps
DevSecOps, a combination of “Development,” “Security,” and “Operations,” is an approach that integrates security practices into the software development and deployment process. It emphasizes collaboration, automation, and continuous monitoring to ensure security measures are incorporated from the earliest stages of development. The benefits of DevSecOps include:
a. Early identification and mitigation of security vulnerabilities
b. Faster and more efficient software development
c. Improved collaboration and communication
d. Enhanced security awareness and culture
e. Automated security testing and monitoring
f. Continuous compliance and auditing
g. Rapid incident response and recovery
h. Cost-effectiveness
Types of Security Techniques
In DevSecOps (Development, Security, and Operations), security techniques are integrated into the entire software development lifecycle to ensure the continuous delivery of secure and reliable software. Here are some common security techniques used in DevSecOps:
i. Static Application Security Testing (SAST): SAST involves analyzing the application’s source code or binary without executing it. It helps identify security vulnerabilities, such as insecure coding practices, potential backdoors, or known vulnerabilities in third-party libraries.
ii. Dynamic Application Security Testing (DAST): DAST involves testing an application in a running state to identify vulnerabilities. It simulates attacks on the application to find security weaknesses, such as injection flaws, cross-site scripting (XSS), or improper access controls.
iii. Interactive Application Security Testing (IAST): IAST combines elements of both SAST and DAST. It instruments the application during runtime to monitor its behavior and identify vulnerabilities. It provides more accurate results by analyzing code execution paths.
iv. Security Code Reviews: Manual code reviews are performed by security experts to identify security flaws that might be missed by automated tools. This technique involves a thorough examination of the codebase, looking for vulnerabilities or insecure coding practices.
v. Security Testing Automation: Automation tools can be used to perform various security tests, including vulnerability scanning, penetration testing, and security assessment. These tools help identify common vulnerabilities efficiently and enable continuous security testing.
vi. Container Security: When using containerization technologies like Docker or Kubernetes, container security techniques are essential. This includes scanning container images for vulnerabilities, enforcing secure container configurations, and monitoring container runtime behavior.
vii. Infrastructure as Code (IaC) Security: DevSecOps also focuses on securing the infrastructure by applying security practices to infrastructure-as-code (IaC) templates. This involves implementing secure configurations, scanning IaC templates for security vulnerabilities, and performing automated security checks during infrastructure deployment.
Advantages of DevSecOps:
1. Recognize Bugs and Vulnerabilities Early.
2. Use open source with assurance.
3. Reduce resource management costs.
4. Educate developers about security.
5. Minimize Legal Liability and Risk
Conclusion:
DevSecOps promotes a proactive approach to security by integrating it into the software development lifecycle. It enables early detection of vulnerabilities, facilitates faster and more frequent releases, fosters collaboration and shared responsibility, ensures compliance with regulations, supports agile and adaptive security practices, and enhances overall risk management.
The SaaS Growth Story
Software-as-a-service (SaaS) on Cloud
Software-as-a-service (SaaS) has been around since the early 2000s and is a cost-effective alternative to the traditional IT deployment where customers have to buy or build their own IT infrastructures, install the software themselves, configure the applications and employ an IT department to maintain it all.
SaaS offers a connection and subscription to IT services built on shared infrastructure via the cloud and deployed over the internet, rather than purchased and downloaded or installed locally.
With the continuous growth of cloud computing and the clear advantages of subscription-based services, it comes as no surprise that the software as a service market continues to expand rapidly. Many organisations are committed to purchasing SaaS solutions rather than buying and hosting software internally.
Furthermore, on a SaaS provider side, this software distribution model makes it possible even for small companies, to reach a broad range of customers, opening doors to new markets and geographies.
„SaaS remains the largest public cloud services market segment, forecasted to reach $176.6 billion in end-user spending in 2022. Gartner expects steady velocity within this segment as enterprises take multiple routes to market with SaaS, for example via cloud marketplaces, and continue to break up larger, monolithic applications into compostable parts for more efficient DevOps processes.” Source: Gartner (April 2022)
Characteristics of SaaS
SEAMLESSLY AVAILABLE & SCALABLE
Uptime and the ability to respond to continually changing requirements and workloads build the basis for any successful SaaS product. Cloud provides a broad range of capabilities like x and y that can be leveraged to align with the uptime requirements of SaaS environments. It also provides dynamic scaling mechanisms that allow for the alignment of tenant consumption with the actual load.
PAY-AS-YOU-GO PRICING
Continuously managing and optimising costs is essential for SaaS providers. With the elasticity of the Cloud, they are able to build SaaS solutions that are optimised to match the infrastructure of a multi-tenant load and its scaling requirements.
GLOBAL REACH
One big advantage of the SaaS model is fast access to new markets and geographies. The availability of the public Cloud in all the principal geographic regions allows for global reach and high availability due to multi-region set-ups.
SECURITY
SaaS solutions hosted in the cloud providers can be distributed over multiple servers scattered in multiple geographical locations and have automatic backups, ensuring an extremely high level of security.
INNOVATION
The breadth and depth of tools and services available on the Cloud can facilitate a faster time-to-market for SaaS providers. The pace of innovation in the Cloud also provides SaaS companies with new services and capabilities to enhance the features, cost, and management profile of their solutions.
Making the shift: from on-prem to SaaS-enabled solutions
SaaS turns the traditional model of software delivery on its head. Rather than purchasing licenses, paying an annual maintenance fee for upgrades and support, and running applications in-house, SaaS allows organizations to buy only the number of licenses they require as their need fluctuate.
For a SaaS provider, the shift from providing on-premises solutions to becoming a SaaS-based solution provider involves intense levels of continuous testing. This means, by becoming a SaaS provider, there needs to be a shift of understanding within the organization to transform from being a software provider to a service provider.
From an operational perspective, this requires new capabilities, such as meeting service level agreements, establishing real-time usage monitoring and billing capabilities, and meeting strict security requirements.
The robust infrastructure required to provide SaaS services 24×7 requires a substantial investment.
The business challenges are even greater, ranging from the dramatically lower margins provided by SaaS, to changes in cash flow and pricing models, to requirements for customer support.
With this in mind, once a decision is made to make the shift, it will be important to rigorously evaluate the different potential SaaS models and adopt an iterative deployment approach allowing for greater learning and flexibility during the course of the deployment. Software companies and their customers should periodically assess their overall SaaS roadmap to regularly check their progress against their strategic goals.
Accelerate your SaaS journey with Ankercloud
While the advantages of a cloud-based SaaS model are strong and allow a company to focus on its core goals of developing, delivering applications, and improving its customer experience, it is important to pay special attention to key components like infrastructure budget management, capacity management, and platform availability. This is where an experienced SaaS partner like Ankercloud can be the key to a successful SaaS adoption. We support our customers on their journey to develop a SaaS model on AWS with a consolidated approach, years of experience, and deep AWS knowledge.
Curious? Reach out to us at cloudengagement@ankercloud.com
Saasification and Cloud Migration for vitagroup: a key player in the highly-regulated German Healthcare sector


Enhancing DDoS Protection with Extended IP Block Duration Using AWS WAF Rate-Based Rules
.png)
Smart Risk Assessment: Bitech’s AI-Driven Solution for Property Insurance

Streamlining CI/CD: A Seamless Journey from Bitbucket to Elastic Beanstalk with AWS CodePipeline


.png)
Setting Up Google Cloud Account and Migrating Critical Applications for Rakuten India
.png)
.png)


.png)
Migration to Cloud and Setting Up of Analytics along With Managed Services

gocomo Migrates Social Data Platform to AWS for Performance and Scalability with Ankercloud

Benchmarking AWS performance to run environmental simulations over Belgium


Model development for Image Object Classification and OCR analysis for mining industry


Achieving Cost Optimization, Security, and Compliance: Ankercloud's AWS CloudOps Solutions for Federmeister


Replication of On-premise Infrastructure into AWS Cloud on Docker Swarm platform

Please Type Other Keywords
The Ankercloud Team loves to listen